Copyright © T3 Live LLC. All Rights Reserved.
Terms of Service | Privacy Policy
Scott Redler is an associated member of T3 Trading Group, LLC (“T3TG”), a SEC registered Broker-Dealer & Member of FINRA SIPC. All trades made by Scott are placed through T3TG.
T3 Live, LLC is a financial publisher that disseminates information about economic, business, and capital markets issues through various media. T3 Live is not a Broker-Dealer, an Investment Adviser, or any other type of business subject to regulation by the SEC, CFTC, state securities regulators or any “self-regulatory organization” (such as FINRA).
Although T3 Live and T3 Trading Group, LLC are affiliated companies by virtue of common ownership, the companies are managed separately and engage in different businesses.
The programs that T3 Live distributes (including the “Virtual Trading Floor,” articles, commentary, videos, blogs and social media postings) are for informational and educational purposes only. No one should consider the information disseminated by T3 Live to be personalized investment advice, a recommendation to buy, sell or hold any investment, an offer (or a solicitation of an offer) to buy or sell any investment, or the provision of any other kind of advice that would require T3 Live to register as a broker-dealer, investment adviser or similar entity. No one associated with T3 Live is authorized to make any representation to the contrary.
T3 Live provides information that viewers of its programs may consider in making their own investment decisions. However, any viewer will be responsible for considering such information carefully and evaluating how it might relate to that viewer’s own decision to buy, sell or hold any investment. Such decisions must be based on that viewer’s individual and independent evaluation of his or her financial circumstances, investment objectives, risk tolerance, liquidity needs, family commitments and other factors, not in reliance on any information obtained from T3 Live.
Statements by any person (whether identified as associated with T3 Live, T3 Trading Group, or any other entity) represent the opinions of that person only and do not necessarily reflect the opinions of T3 Live or any other person associated with T3 Live.
It is possible that any individual providing information or expressing an opinion on any T3 Live program may hold an investment position (or may be contemplating holding an investment position) that is inconsistent with the information provided or the opinion being expressed. This may reflect the financial or other circumstances of the individual or it may reflect some other consideration. Viewers of T3 Live programs should take this into account when evaluating the information provided or the opinion being expressed.
Although T3 Live strives to provide accurate and reliable information from sources that it believes to be reliable, T3 Live makes no guarantees as to the accuracy, completeness, timeliness, or correctness of any such information. T3 Live makes no guarantee or promise of any kind, express or implied, that anyone will profit from or avoid losses from using information disseminated through T3 Live.
All investments are subject to risk of loss, which you should consider in making any investment decisions. Viewers of T3TG programs should consult with their financial advisors, attorneys, accountants or other qualified professionals prior to making any investment decision.
The risk of loss in trading equities, options, forex and/or futures can be substantial. You should therefore carefully consider whether such trading is suitable for you in light of your financial condition. The high degree of leverage that is often obtainable in options trading may benefit you as well as conversely lead to large losses beyond your initial investment. Past results are not indicative of future results. No representation is being made that any account will or is likely to achieve profits similar to those shown.
T3 Trading Group, LLC is a Registered SEC Broker-Dealer and Member of FINRA/SIPC. All trading conducted by contributors associated with T3TG on the Virtual Trading Floor is done through T3TG. For more information on T3 Trading Group, LLC please visit www.T3Trading.com.
You got it!
Your free report will be in your inbox in 5 minutes from me, Scott Redler. Check spam if you don't see it yet.
In the meantime... here's what I'm trading now!


You Were Right About the Stock. So Why Did You Lose Money?
It wasn't your pick. Nobody ever handed you the exit. Every Power Play comes with the entry, the level it has to hold, and exactly when I sell — in thirds, into strength.
How every Power Play works
- Set the needs-to-hold levelBefore I buy, I decide where I'm wrong
- Buy at the planned entryWith the whole plan already written
- Sell the first thirdGet paid on the first pop
- Sell another thirdTake more off as it climbs
- Let the last third runNo need to call the top
As seen on CNBC · Fox Business · The Wall Street Journal · Forbes · MarketWatch
MUU. Bought at $31.19. Sold the first third the very next day. Last third out at $37.27 — six days, paid the whole way up.
RDW. In at $9.12. Thirds sold at $10.39, $12.83 and $12.23. About +29.6% blended in under a month.
HOOD. Broke my level the day after I bought it. Out at −5.8%. Small, fast, done — and back in three months later for about +11.1%.
Three trades. Same rule every time:
I decide where I'm wrong before I buy. And I decide how I'll sell before I buy.
That's the difference between the people who keep what they make in this market… and the people who watch a nice gain turn into a loss.
I'm Scott Redler. I've traded professionally since 1998, and below you'll see every Power Play since 2021 — losers included.
Results from the Power Plays tracking sheet; blended returns average each idea's exits, before commissions and fees. Past performance does not guarantee future results.
Does any of this sound familiar?
- You bought a stock after you heard about it on TV, right near the top.
- You were up 15%… didn't sell… and watched it slide all the way back to red.
- You sold your winner too early "to be safe," then it kept running without you.
- You held a loser for months because you "believed in the company."
- You never had a number in your head for where you'd get out if you were wrong.
- You're drowning in watchlists, newsletters and headlines… and still don't know what to buy this week.
None of that means you're bad at this.
It means nobody ever handed you a plan for the part that matters most: the exit.
Most investors spend all their energy on what to buy. Then the stock moves, and they're making it up on the fly — real money on the line, emotions running the show.
That's not a discipline problem. It's a missing-plan problem. And it's fixable.
What it looks like when the plan is written first
in 10/3/24
in 12/19/25
in 9/4/25
in 1/2/26
10/8–11/19/25
Blended stock returns across each idea's exits, weighted by the size of each sale, with entry and exit dates from the Power Plays tracking sheet. Past performance is not indicative of future results.
Yes — I have losers. Plenty of them. ETHE cost us about 33%. Most losses are much smaller than that, because I cut them when the level breaks. You'll see the whole record below, every trade since 2021.
But first, you should know who's sending you these… and why I'm so stubborn about having a plan.
25+ years on Wall Street. Every kind of market.
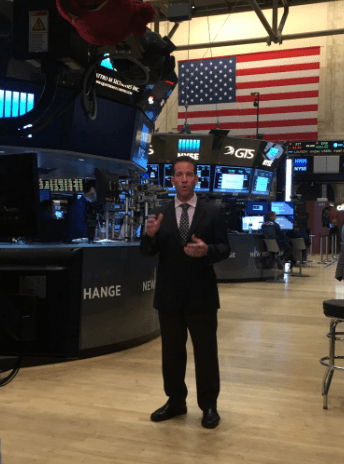
A licensed pro, two blocks from the NYSE
I've traded professionally since 1998 — through the dot-com bubble, the 2008 financial crisis, COVID, multiple bear markets and more than one mania.
In 2007, I co-founded T3 Live. Today I'm an Associated Member of T3 Trading Group, an SEC-registered broker-dealer — which means I play by stricter rules than any YouTube "guru."
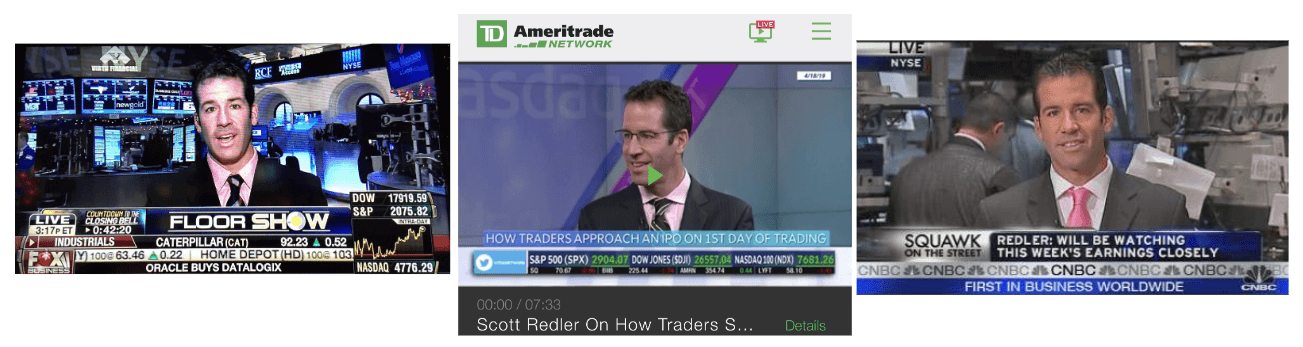
The guy the networks call
I've broken down markets on CNBC and Fox Business for years, and I've been featured in The Wall Street Journal, Forbes, MarketWatch, TheStreet and Investor's Business Daily.
Since 2011, I've recorded more than 2,000 market videos — a daily show from 2011 to 2016, then pre-market and post-market breakdowns every trading day since.
A few calls I made in public — on the record
"The market is about to crash."
I said it live on the trading floor with the cameras rolling. The anchors laughed in my face. It's still on YouTube. They kept having me back.
"Sell everything."
Right before the fastest crash since the Great Depression. Then in April 2020, just after the bottom, I said it was time to start buying again.
Gold at $700 → $1,500
They laughed at me again when I said money printing and debt would send gold to $1,500. It got there.
Top 7 poker players
Named one of the top poker players on Wall Street, alongside billionaires Carl Icahn, Ken Griffin, Cliff Asness and Steve Cohen. Reading risk is the job.
Past market commentary shown for background only. These are not Power Plays trade results. Past performance does not guarantee future results.
The morning I learned what a plan is really worth
About eight months into my career, in the teeth of the tech bubble, I held a position into the close. After hours, it moved against me.
I had no plan for that. So I did the worst possible thing… I added to it.
The loss went from around $40,000 to $60,000. By the next morning it was near $90,000. I finally got out for roughly an $80,000 loss. My parents were hairdressers — that was more than they made in a year.
The most painful part wasn't that the stock went against me. It was that I had no decision made until the market forced me to make one.
Every Power Play I send you today is built so that never happens to you.
Why smart investors still give back their gains
It's usually not the stock they picked. It's that they had a plan to buy… and no plan at all for what comes next.
| Most investors | A Power Play | |
|---|---|---|
| How they find it | A hot stock on TV or social media | The leading stock in the leading sector |
| When they buy | After it already ran | At a planned entry, plan written first |
| If it goes wrong | Hold and hope it comes back | Out when the needs-to-hold level breaks |
| If it goes right | Sell too early, or ride it back down | Sell in thirds, paid on the way up |
| What's left | A good pick that became a bad trade | Small losses, winners that stay winners |
The two rules behind every Power Play
Every idea has a needs-to-hold level
Before I buy, I write down the price the stock has to stay above for my idea to still be right. If it breaks, I'm out. No arguing. No "it'll come back."
I sell in thirds
A third into the first pop, another third higher, and I let the last third run. You get paid along the way — and a winner has a much harder time turning into a loser.
Here's what an actual Power Play alert looks like:
"Apple is holding in well, and it looks like it's getting ready to make new all-time highs. So we're adding it to Power Plays here."
The stock, the price, the level it needs to hold, and why. Read it in thirty seconds. Act on it in sixty.
Four recent Power Plays — including one that didn't work
Here's exactly what it looks like when you follow the plan. Every buy, every third, every exit.
MUU
≈ +14.4% blended · 6 daysBought 9/17/26 · sold thirds 9/18, 9/21 and 9/23/26
The next day I sold the first third. Two trading days later, another. The last third came out at $37.27. I was getting paid the whole way up.
SPCX
≈ +16.2% blended · 4 daysBought 8/6/26 · sold thirds 8/7, 8/7 and 8/10/26
It moved fast, so the thirds came fast — two the very next day, the last one two trading days later.
RDW
≈ +29.6% blended · under a monthBought 1/2/26 · sold thirds 1/5, 1/23 and 1/27/26
Notice the last third sold lower than the second? That's the plan working. I don't try to sell the exact top.
HOOD
A small loss… then a winLoss: bought 3/2/26, out 3/3/26 · Win: bought 6/11/26, sold thirds 6/12, 6/15 and 6/15/26
March: bought at $78.75, broke my level the next day, out at −5.8%. Small, fast, done. June: it set up again and the thirds paid about +11.1% blended in four days. The small loss kept me in the game for the bigger win.
Examples from the Power Plays tracking sheet. Bars show each sale's gain or loss from the entry price. Blended returns average each idea's exits equally, before commissions and fees. Not a complete record; the full record, losers included, is below. Past performance does not guarantee future results.
The full record — ugly trades included
Most "gurus" show you the winners and bury the rest. Here's every closed Power Play on the sheet, September 2021 through September 2026:
Read that again. Fewer than half of the ideas win. That's exactly why the needs-to-hold level exists. Keep the losers smaller than the winners, and let the thirds do the rest.
Put the same $10,000 into every one of those 342 ideas — winners and losers — split evenly across each idea's exits:
Hypothetical illustration only. Assumes $10,000 per closed stock idea on the Power Plays tracking sheet, split evenly across its partial exits, before commissions and fees. Excludes open positions and options rows. Not a managed-account result and not a projection of future results.
Not because most trades win. Because the winners are bigger than the losers.
One honest word: the last twelve months have been choppier, with more small stop-outs as the market rotated hard. That's the reality of trading — and exactly why every idea comes with a level. Size every position so a stop-out is something you can shrug off.
What traders are saying about Scott
Scott brings you a clear vision of how to approach the market each day and is with you every step of the way.
Moshe, subscriberI have been investing for over 30 years and have an 8 figure account. Scott has made me a better trader, period.
Chris, subscriberI have been in and out of the stock, commodity and options markets for more than 50 years. Scott Redler is the best guide I have ever known…
Tzvi, subscriberI've wasted a lot of time and money trading on my own. I wish I knew about Scott Redler sooner.
Mike, subscriberTestimonials Disclosure: The customer feedback provided is reported by our customers and is not verified. Because it is difficult to track the success of all of our customers, we want to make clear to you, the potential customer, that you should not expect results similar to those described by our customers above. No consideration was paid for these testimonials. While we offer insights, guidance and training on trading the financial markets, we do not make any guarantees that you will make any money, or that you will make any of your investment in our services back. As with all investments in the financial markets, there is extreme risk, and you should evaluate your personal risk profile prior to making any investment.
Welcome to Power Plays
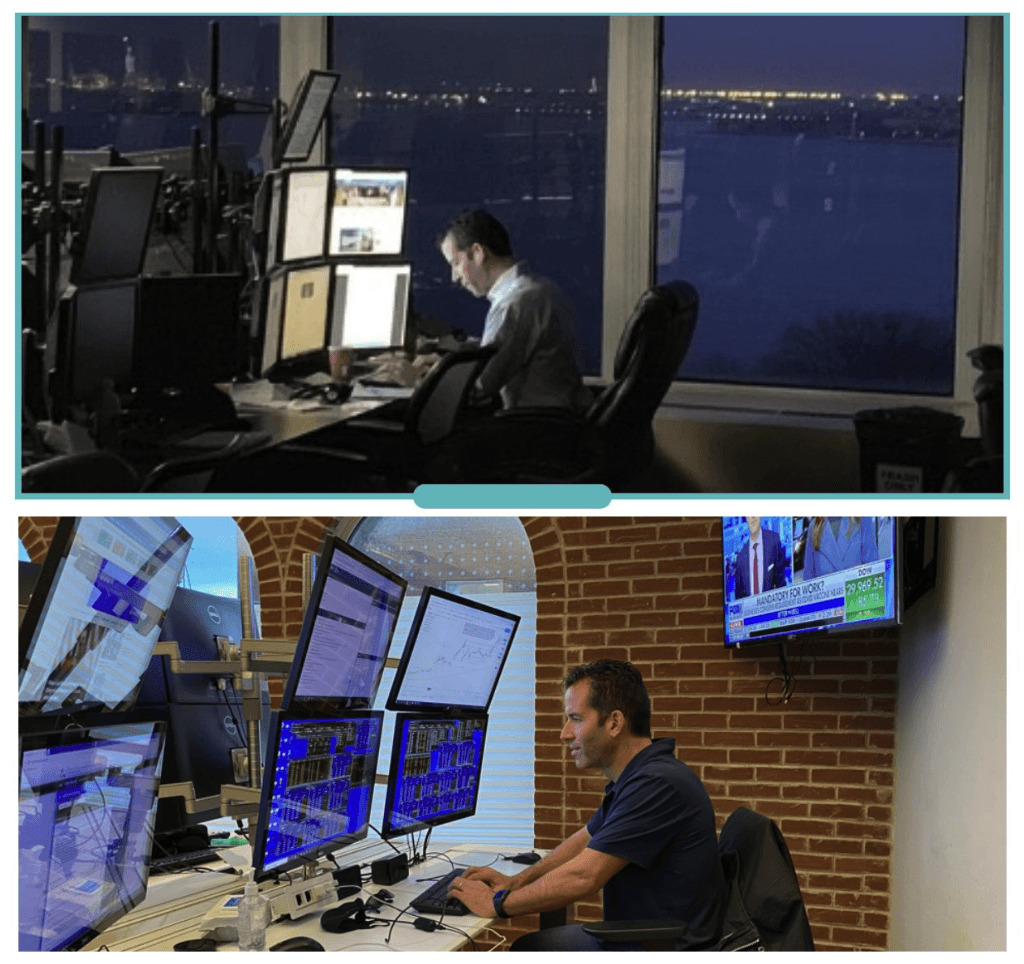
I'm up at 4:45 every morning and usually the first one in the office at T3 Live — charts up hours before the bell.
For years, my best stock ideas lived inside our premium rooms. But people kept asking for one simple thing: just tell me the stock you like, where it needs to hold, and when you're selling.
That's Power Plays. My highest-conviction stock setups, sent the moment they set up — market-timed, not calendar-timed — with the full plan attached.
What actually changes for you
- You stop guessing what to buy. One to three high-conviction setups a week.
- You know where you're wrong before you're in, because every idea has a needs-to-hold level.
- You get paid on the way up by selling in thirds. No more round-tripping a winner.
- You see every trade, winners and losers, on a live tracking sheet.
Here's everything you get
A full year of Power Plays + my complete Path to Profits course
- Power Play alerts: 1–3 high-conviction stock setups a week, sometimes more
- The full plan on every idea: the stock, the entry price, and the needs-to-hold level
- An alert every time I sell a third, adjust, or exit — by email and text
- The Friday Power Plays Roundup: what worked, what didn't, and what I'm watching next week
- The live tracking sheet: every open and closed position, down to the penny
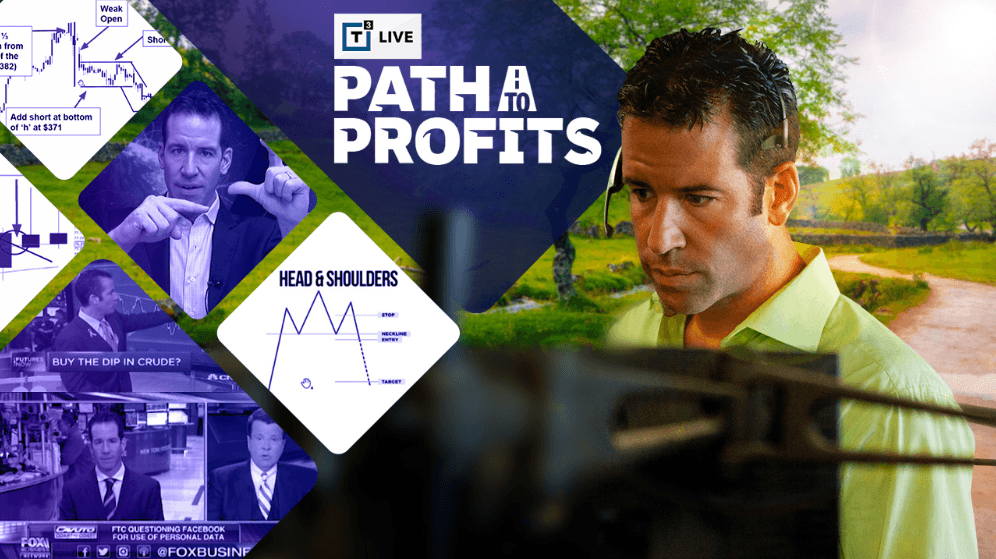
Included free: my "Path to Profits" video course. 7 modules and a 179-page guide covering the Red Dog Reversal, the H Sell, my Tier System for taking profits and my moving average system — the core of the flagship course that sold for $4,995 live.
At the regular monthly rate, a year of Power Plays is $468. Path to Profits sells for $95 on its own.
Put $10,000 into every idea I've sent since 2021 — every winner and every loser — and you'd be up about $21,932 (hypothetical, before commissions and fees). That's before you learn a single thing about doing it yourself.
But the bigger value is what you stop doing. No more buying the top because a stock was on TV. No more round-tripping a 15% gain. No more holding a loser for a year because you "believe in it."
$99 is less than you'd lose on one bad trade — and it covers twelve months of alerts and my complete video course.
GUARANTEE
Try it for the full 30 days. Watch how I pick the stocks, set the levels, and sell the thirds, and start the Path to Profits course. If it's not for you, get your $99 back. No questions asked.
What I can't guarantee is what the market does with your money. Nobody honest can, and I won't pretend otherwise.
The market decides.
Some weeks I send one idea. Some weeks, three. When a stock sets up right, members get the alert — whether it's 7 AM or 2 PM. Everyone else reads about the move afterward.
Keep doing it alone
Keep buying what's on TV. Keep guessing when to sell. Keep watching good picks turn into round trips — and losers you hold for way too long.
Trade with a plan
Let a trader who's done this since 1998 hand you the stock, the level it needs to hold, and every sell. Then decide for yourself whether to follow along.
$99 for the year, Path to Profits included, with a 30-day money-back guarantee.
To knowing where you're wrong before you buy,
Scott "Red Dog" Redler
Co-founder, T3 Live · Editor, Power Plays